Public data · Live
MaineStats
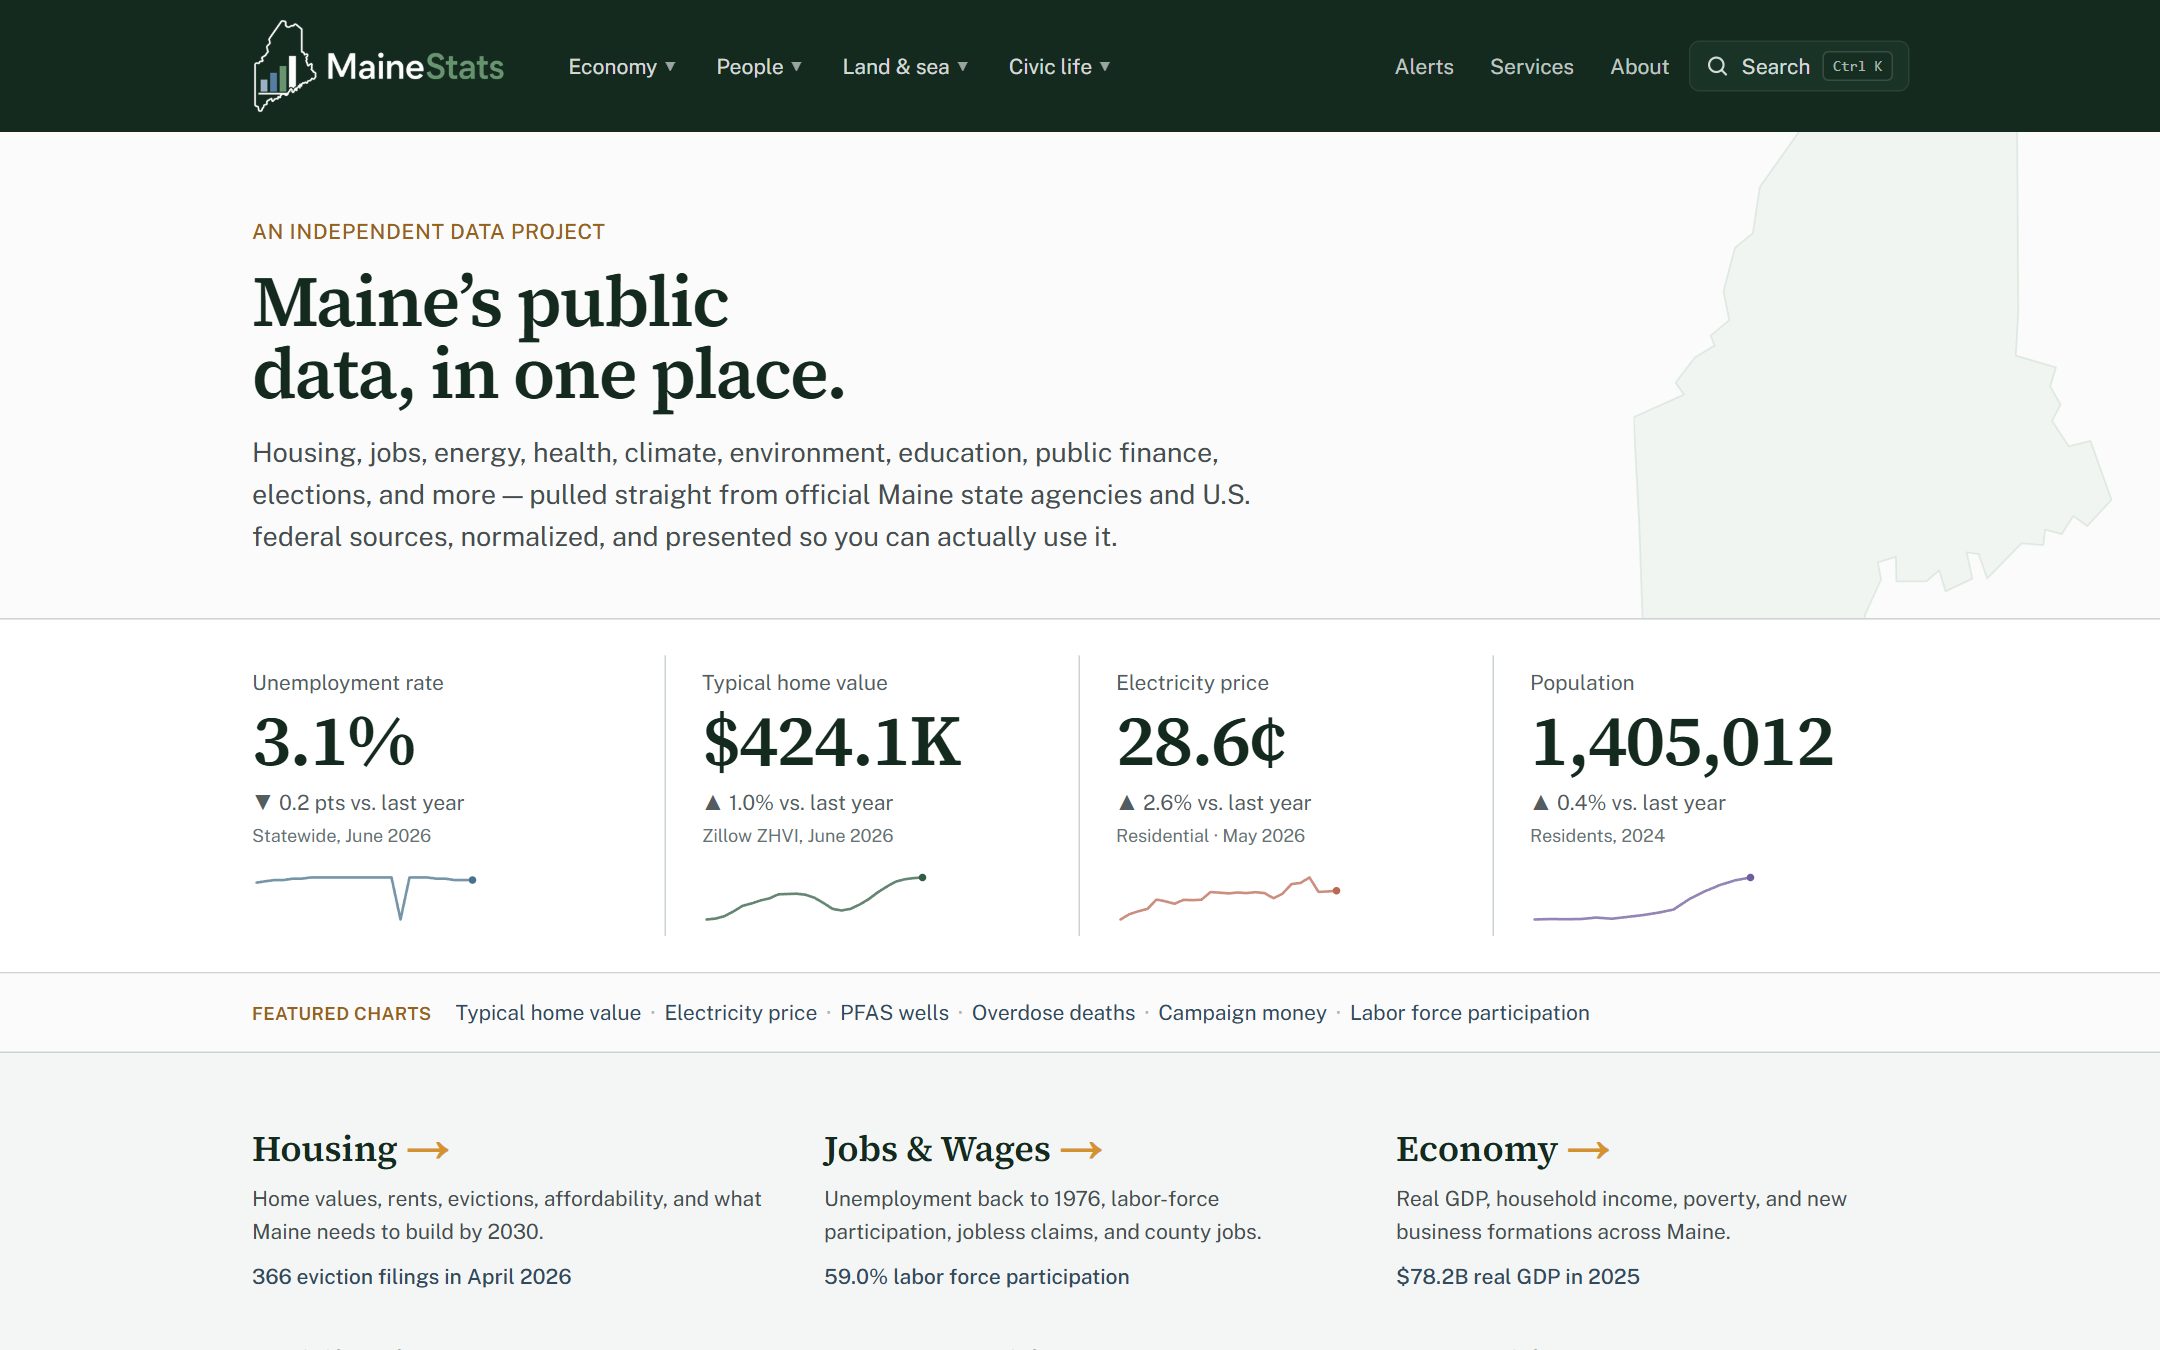
Maine's public data in one place. 142 tracked metrics across 15 topic areas, fed by about 31 ingestion pipelines from state and federal sources.
- Role
- Sole builder: design, pipelines, charts, deployment
- Timeline
- A few weeks, April to May 2026
- Status
- Live
- Live site
- mainestats.org
~31
Ingestion pipelines
142
Tracked metrics
15
Topic areas
~25
Upstream sources
Problem
Good data about Maine exists. Finding it was the problem. State and municipal figures sit across dozens of agencies in whatever format each one settled on, and nothing put them in the same place or on the same footing.
MaineStats pulls from official state agencies and federal sources, normalizes what comes back, and presents it in a form you can use without turning it into a research project.
What I built
15 topic areas and 142 tracked metrics, drawn from roughly 25 upstream sources. Housing, jobs, energy, health, climate, environment, education, public finance, and elections.
About 31 ingestion pipelines keep it current. Methodology, sourcing, and data status are all published, so anyone can trace a number back to where it came from and see how fresh it is.
Outcomes
Live at mainestats.org.
What I'd do differently
With 25 sources, each new one arrived as its own small problem. I should've written a single ingestion contract at the start, covering expected shape, refresh cadence, and what failure looks like. Adding a source would then have been configuration instead of another bespoke pipeline.