Internal platform · Permitting & zoning · AEC · Pre-launch (2026)
Permitting Portal
Firm-wide project and client portal for a ~400-person AEC firm. It tracks permitting end to end, and grades jurisdictions against the review times they publish.
- Role
- Product owner, designer, project manager, and sole builder
- Timeline
- 2026
- Stack
- Next.js, Supabase, Vercel
- Status
- Pre-launch (2026)
~400 people
Firm size
Thousands of active projects
Designed for
Multiple US states
Coverage
Problem
A ~400-person AEC firm needed one place for its projects and its clients, built for thousands of active projects across every client and several US states, with permitting tracked from first submission to approval.
What it replaces had grown up piecemeal. Permit status lived in scattered systems and in people's heads. If you wanted to know where something stood, or when it would clear, you asked whoever had touched it last.
Constraints
This is client-facing internal work. There's no public link, and every screenshot here runs on demo data.
What I built
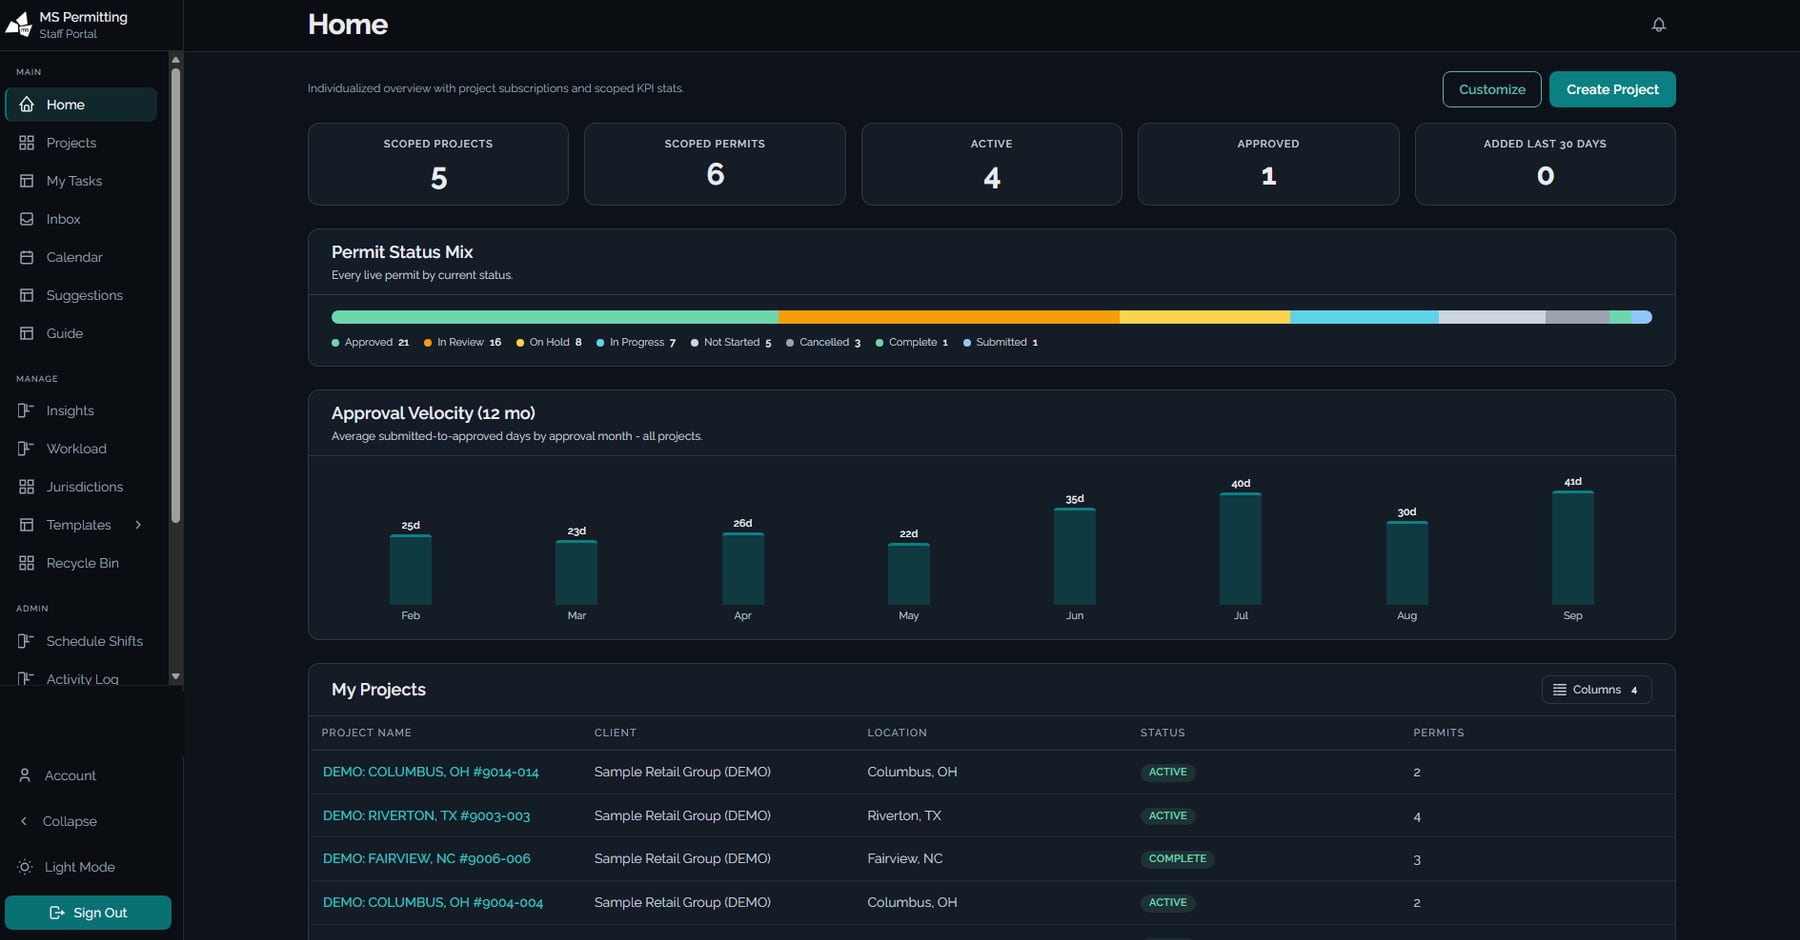
Permitting is tracked across thousands of active projects, every client, and multiple US states. The model runs from projects down through permits, review rounds, stages, and individual tasks. Two front ends sit on it, one for staff and one for clients.
Above that is an analysis layer, computed live from review-round history. It predicts lead times, tracks approval velocity month over month, measures how often approvals land on or before their projected date, and ages open blockers.
The part I get the most out of is the jurisdiction and department benchmark. It sets each department's real review days against the review time that department publishes, broken out by building, planning, and zoning for every jurisdiction a project touches, worst overruns at the top. Two towns can both advertise a 30-day review and behave nothing alike. People always knew that. Now it's on a screen with numbers attached.
Stages and tasks can wait on each other, with lag measured in business days, and projected dates recompute as those links change. A chain diagram draws the result. It sits over an editor that works entirely by keyboard and screen reader, so the diagram is a convenience rather than the only way in.
Scheduling runs through month, list, and Gantt views, filterable by client and by person, with bars from first submission to approval so planned dates sit next to real ones. The rest covers workload, jurisdictions, templates, an inbox, suggestions, an activity log, and light and dark modes.
Architecture
Next.js on the front, Supabase behind it, deployed to Vercel. I designed the data architecture, wrote the application, and did the work of fitting it to how the firm already operates.
Outcomes
It's been through C-suite review and a security and compliance gap assessment.
Pre-launch as of 2026.
What I'd do differently
The analysis is only worth trusting once enough review rounds are on record. A department needs several approved rounds before its benchmark means anything. Starting again, I'd capture that history from day one, before any of the analysis existed, so the predictions arrived useful instead of thin.
Security and compliance review arrived as a gate near the end. I'd pull that assessment into the design phase next time, when the answers are still cheap to act on.
Gallery
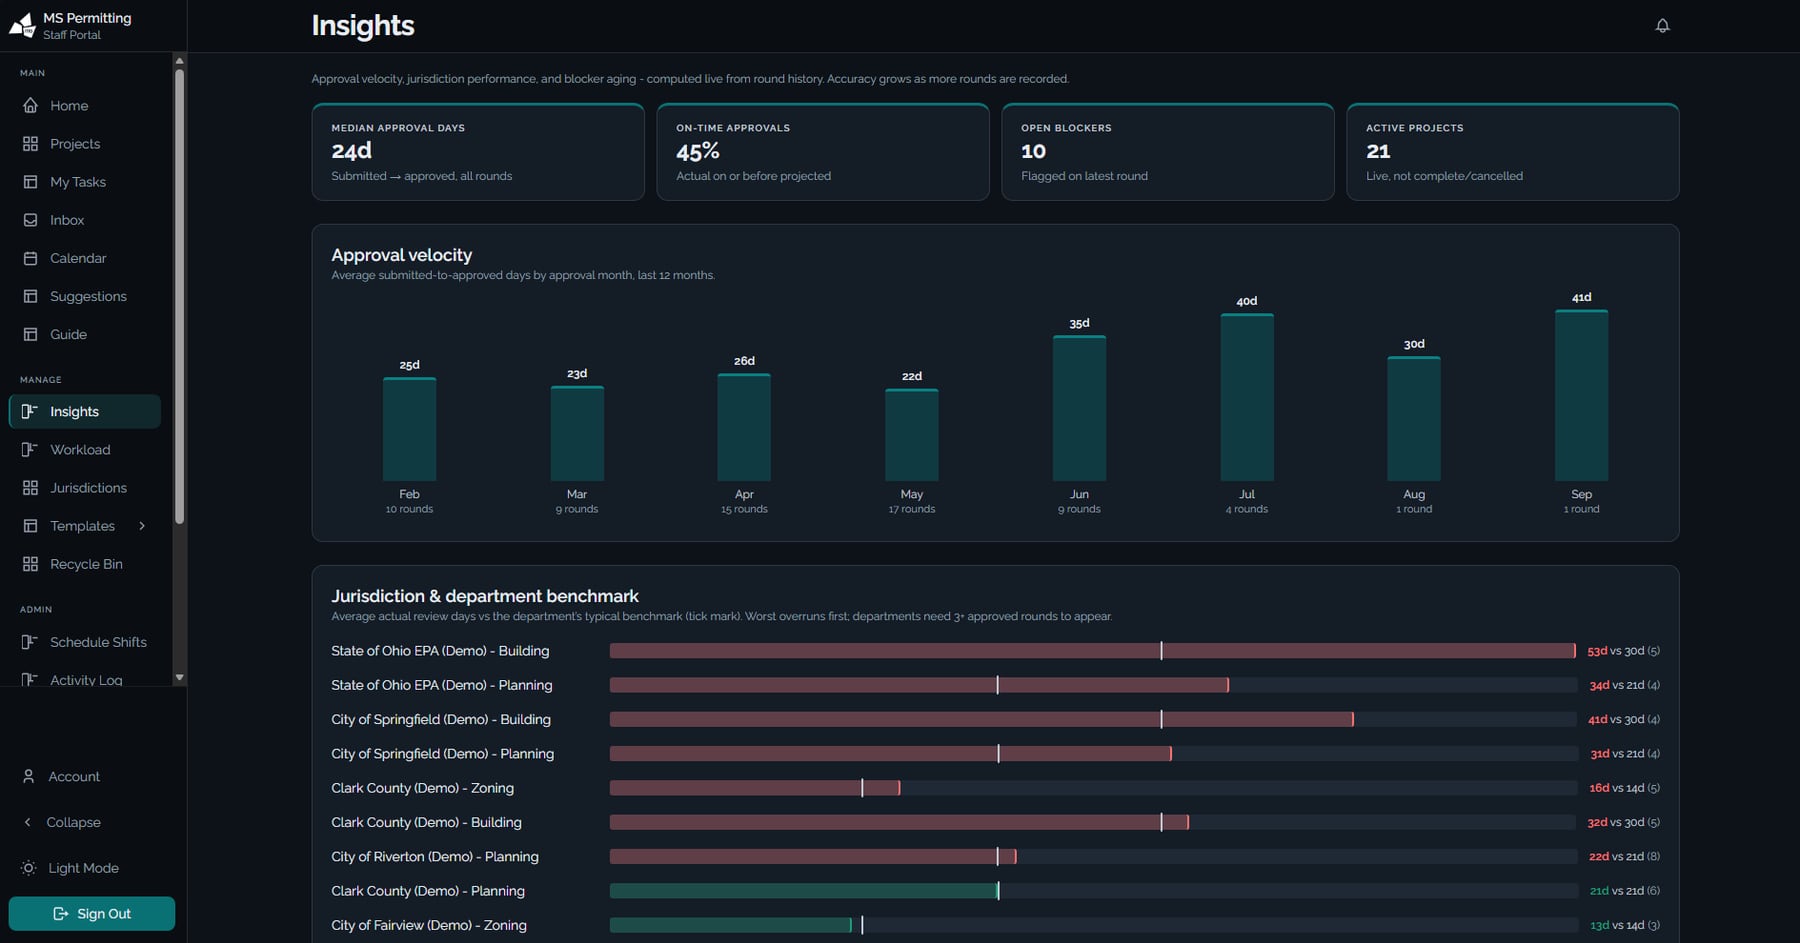
Insights: median approval days, on-time rate, blocker aging, and jurisdiction benchmarks against stated review times. Demo data. 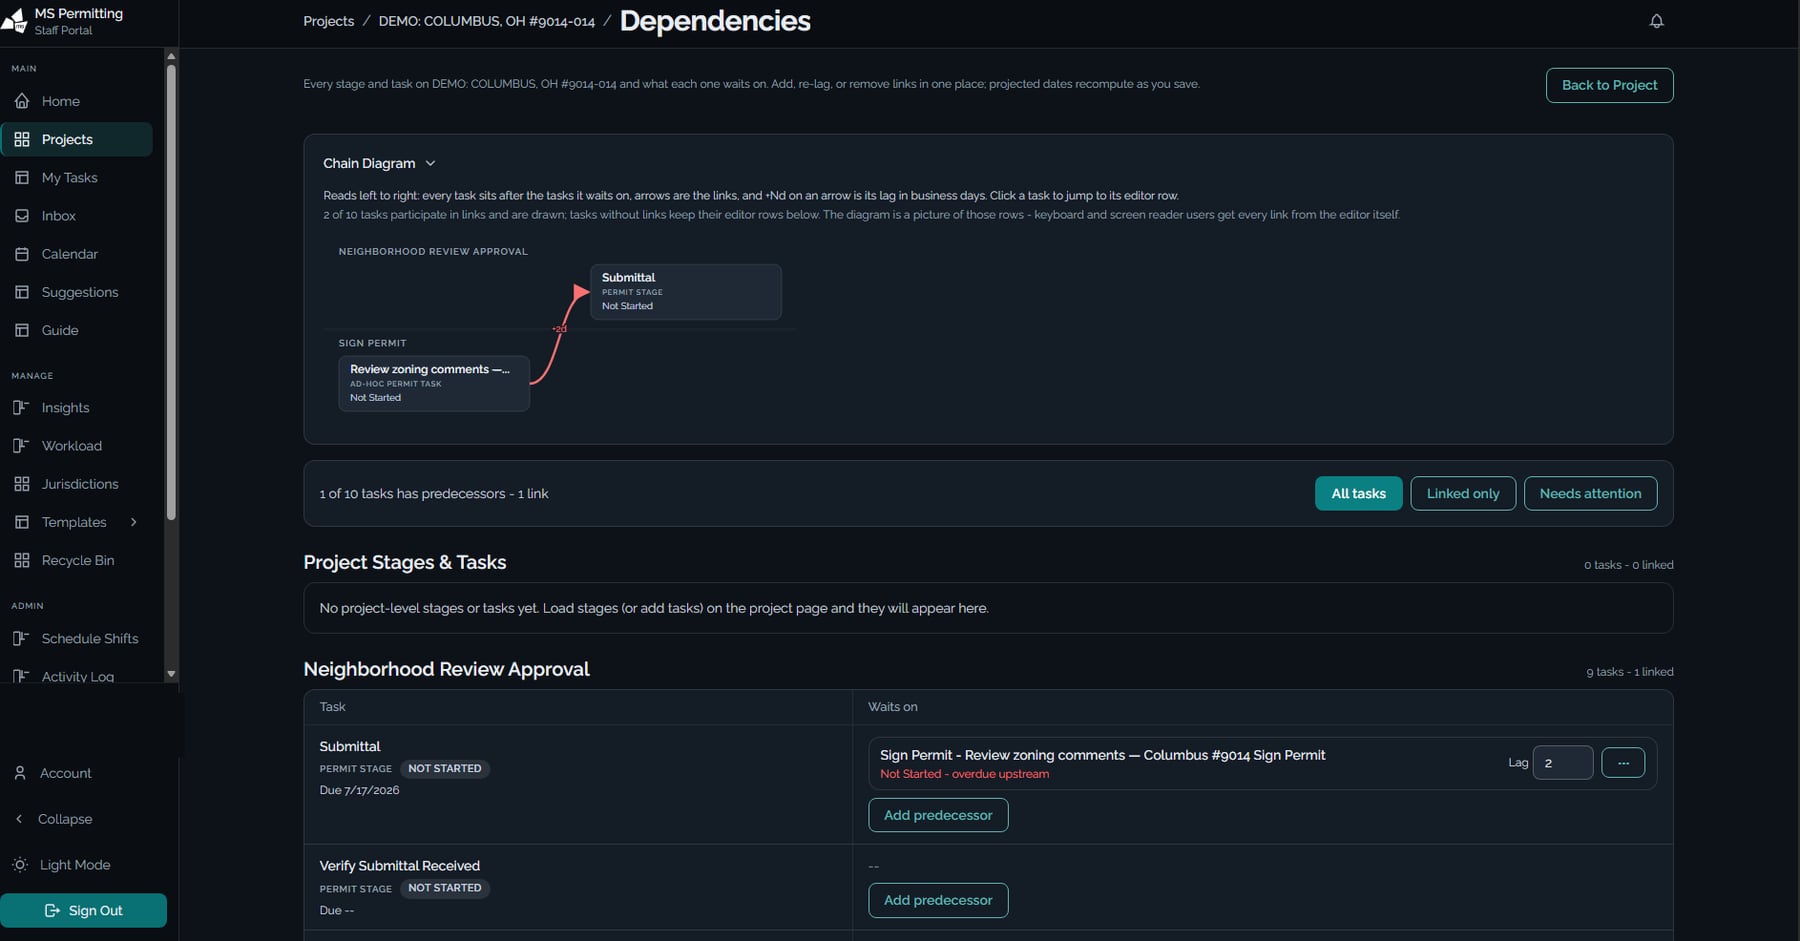
Dependencies: chain diagram over the editor. Lag in business days, projected dates recompute on save. Demo data. 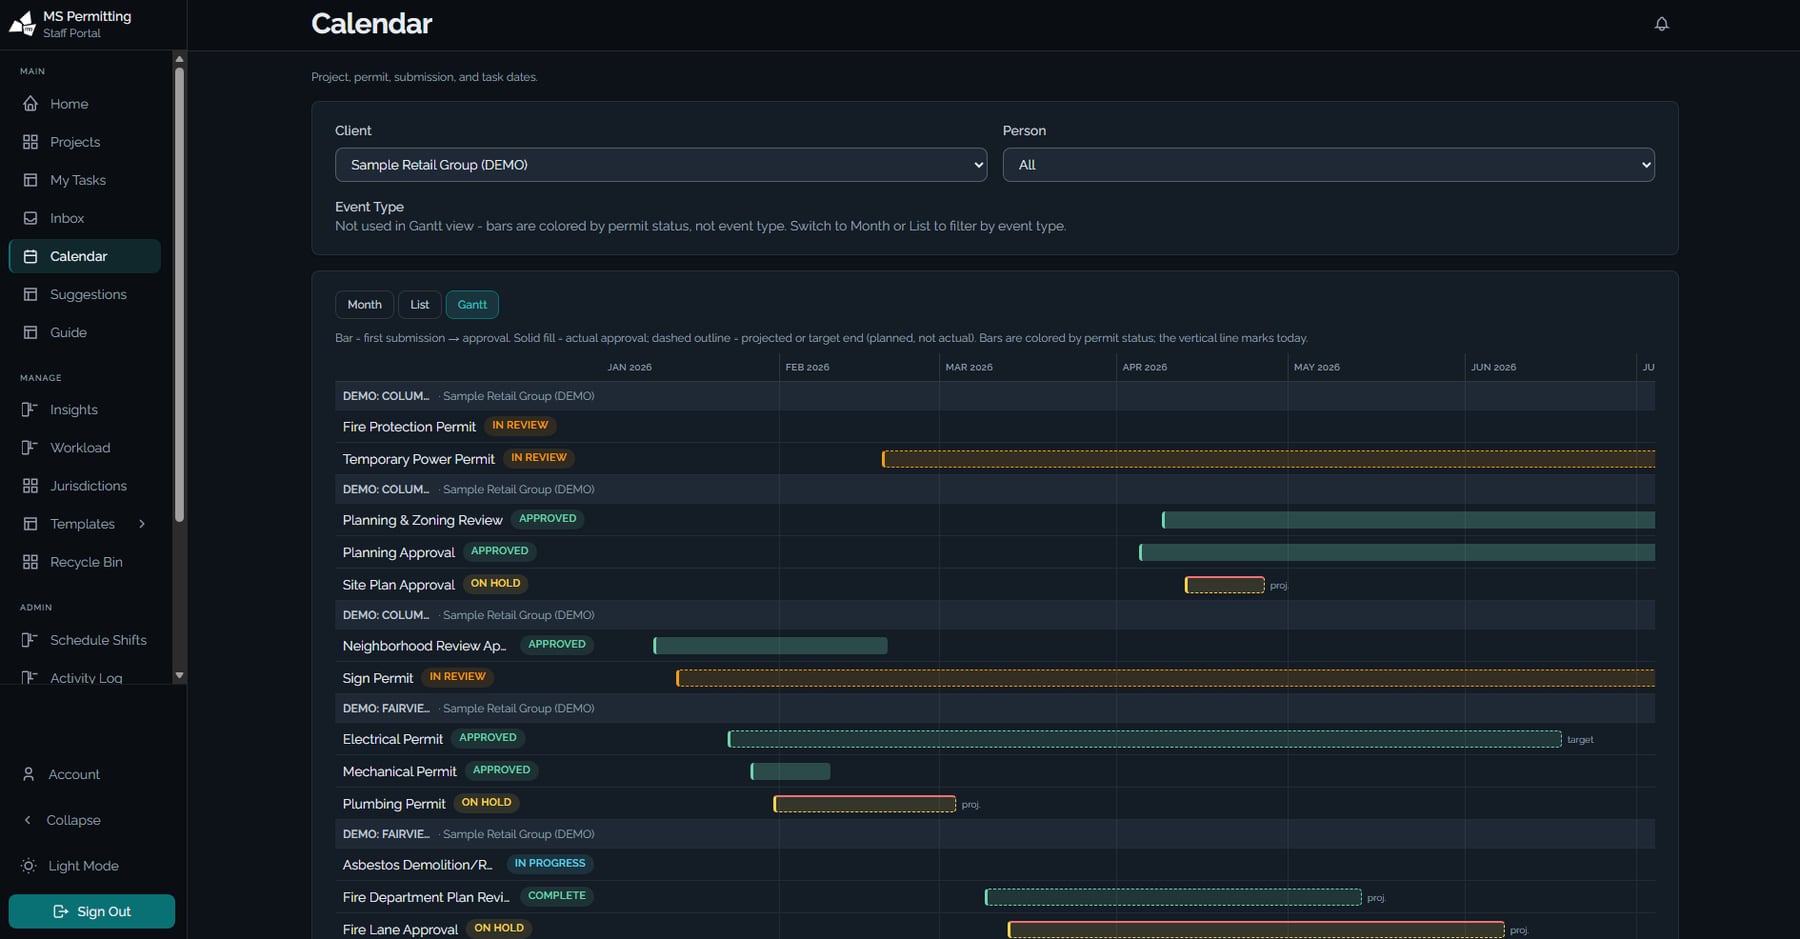
Calendar in Gantt view. Actual against projected, colored by permit status. Demo data.